


Overview
Version V1 expands analytical capabilities by introducing advanced destination-level insights, SIP error breakdown visibility, and improved connected vs non-connected trend comparison.
This release strengthens troubleshooting, carrier analysis, and destination performance monitoring.
Weekday Filter Added

What was implemented:
- Added a new Weekday filter at the dashboard level.
- Users can now filter data by specific days of the week.
- The filter dynamically updates:
- KPI summary cards
- Traffic trends
- Short Call Duration analysis
- DID performance sections
- Early Media ranking
Purpose:
To enable more granular analysis of call behavior by day of the week.
This allows users to:
- Identify weekday performance patterns
- Detect weekend vs weekday traffic variations
- Analyze operational trends
- Spot anomalies linked to specific days
Download Buttons for Connected & Non-Connected Attempts
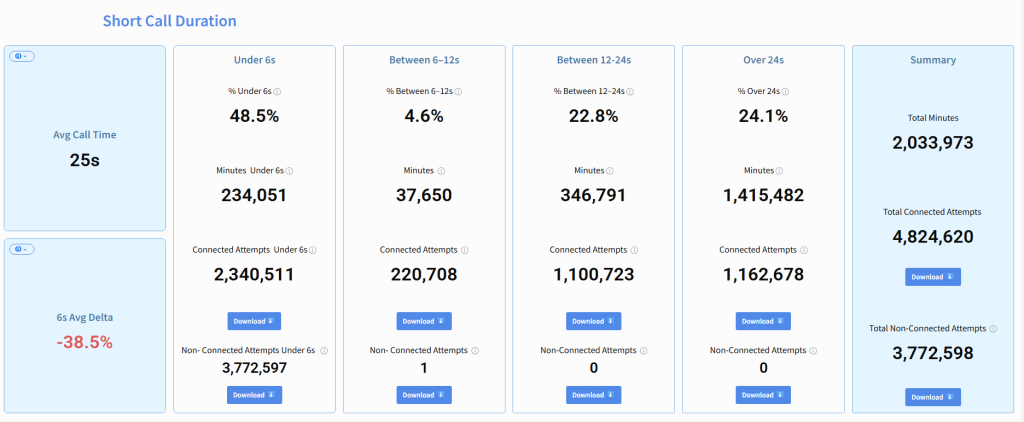
What was implemented:
- Added dedicated Download buttons under:
- Connected Attempts
- Non-Connected Attempts
- Enabled export functionality for each Short Call Duration bucket:
- Under 6 seconds
- Between 6–12 seconds
- Between 12–24 seconds
- Over 24 seconds
- Added export option in the Summary section as well.
Purpose:
To allow users to:
- Extract raw datasets for external analysis
- Share segmented results with operational or technical teams
- Perform deeper investigation outside the dashboard
- Support reporting and auditing processes
Destination-Level Performance Analysis
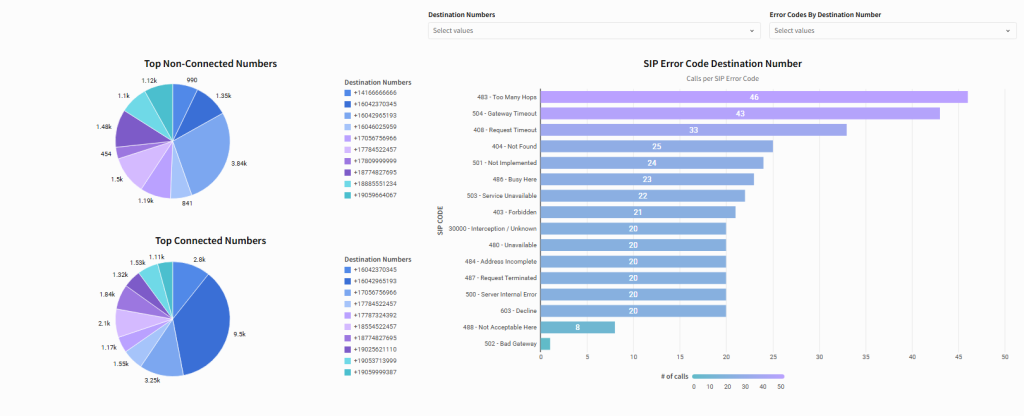
Top Connected & Non-Connected Numbers
What was implemented:
- Added two new visualizations:
- Top Connected Numbers
- Top Non-Connected Numbers
- Displayed as pie charts for quick volume comparison.
- Shows:
- Call volume distribution by destination number.
- Relative contribution of each number.
- Includes a dynamic Destination Numbers filter.
Purpose:
To identify:
- High-performing destination numbers.
- Numbers generating the highest failure rates.
- Potential problematic routes.
- Traffic concentration patterns.
This enables faster detection of abnormal performance per DID.
SIP Error Code – Destination Number Breakdown
What was implemented:
- Added a horizontal bar chart showing:
- Calls per SIP Error Code.
- Introduced filter:
- Error Codes by Destination Number
- Displays error distribution such as:
- 483 – Too Many Hops
- 504 – Gateway Timeout
- 408 – Request Timeout
- 404 – Not Found
- 486 – Busy Here
- 503 – Service Unavailable
- And others.
Purpose:
To provide:
- Clear visibility of carrier or routing-related failures.
- Root cause identification by SIP response.
- Destination-specific error trend analysis.
- Faster troubleshooting for network or routing issues.
This section transforms raw SIP data into actionable operational insight.
Connected vs Non-Connected Daily Comparison

What was implemented:
- Added side-by-side bar chart:
- Connected Calls
- Non-Connected Calls
- Daily breakdown view.
- Numeric values displayed directly above bars.
- Supports trend correlation analysis.
Purpose:
To:
- Visually compare success vs failure trends.
- Detect days with abnormal failure spikes.
- Monitor connection stability over time.
- Support operational and quality reviews.
Updated V1 Scope Summary
Version V1 now includes:
✔ Weekday filtering
✔ Download/export functionality (Connected & Non-Connected)
✔ Destination-level performance ranking
✔ SIP error code analysis by destination
✔ Daily comparison of Connected vs Non-Connected calls
✔ Enhanced troubleshooting visibility
V1 Impact
This release significantly improves:
- Root cause analysis capabilities
- Carrier and routing performance visibility
- Destination-level troubleshooting
- Operational reporting workflows
- Analytical flexibility
Version V1 evolves the dashboard from a monitoring tool into a performance investigation and diagnostic platform.